MRN AI Smart Dashboard: Empower Your Entrepreneurial Success
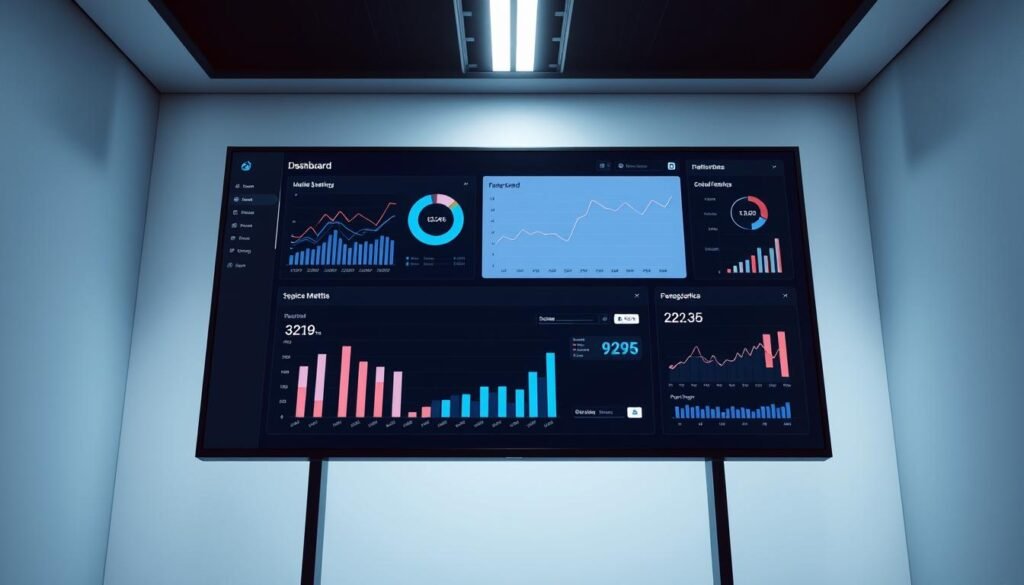
Could one screen change how you run your company?
This Buyer’s Guide answers that question directly and shows how a simple, powerful dashboard turns scattered data into clear actions. You’ll read plain English guidance on what the tool does, what you need to start, and how quickly you can see outcomes.
Expect real results: consolidated dashboards that cut tab-flipping, automatic reports, plain-language queries, and one-click changes that save time and reveal revenue opportunities.
More than two in five companies already use dashboards to act on data, and adoption is rising fast. Learn why this matters now and how to get set up without code or analysts. Ready to try it? See the tool in action and start turning data into decisions with a guided setup.
Read the trend that’s driving solo and then evaluate the dashboard that makes those trends work for your growth.
Key Takeaways
- One consolidated dashboard simplifies decision-making and saves hours each week.
- The platform converts raw data into actionable insights without code or analysts.
- Expect faster outcomes: automated reports, alerts, and plain-language queries.
- Setup is practical and quick—connect sources, set views, and go live.
- Focus on outcomes: uncover revenue, reduce costs, and improve team time.
- Try the guided demo to see how the dashboard fits your current stage.
Stop Guessing, Start Growing: Does an AI Dashboard Actually Solve Your problem today?
If you want faster wins, this guide shows whether a single screen can turn your scattered metrics into immediate action.
How this Buyer’s Guide addresses your immediate search intent
Two in five companies already use dashboards to guide strategy, yet many owners still juggle fragmented tools.
We focus on quick wins. You’ll learn how natural language queries and automated reporting make data accessible and usable this week, not months from now.
Why small businesses win with data-driven, AI-powered decisions
Adoption is rising: 43% of owners used AI in sales in 2024, up from 24% in 2023. That shift creates a clear competitive trend.
Practical benefits include faster reporting, early trend detection, and less time spent assembling slides. Owners use these tools to prioritize campaigns, adjust budgets, or flag risks before they escalate.
“Tools that reduce guesswork give small teams the time to act — and to grow.”
- Clear intent: get better decisions this week with simpler views.
- Less busywork: automated summaries save reporting time.
- Faster action: scan KPIs, spot trends, and move on.
| Need | What to expect | Why it matters |
|---|---|---|
| Consolidation | One view for key sources | Stops tool fragmentation and saves time |
| Speed | On-demand answers in plain English | Faster decisions, less analysis lag |
| Outcomes | Automated reports and predictive cues | Spot trends early and protect growth |
Try it now: Validate this with a test drive — start here: https://businessgoeslocal.com/MRN-AI-Smart-Business-Dashboard
What Is the MRN AI Smart Business Dashboard AI for entrepreneurs?
Imagine turning scattered spreadsheets into clear weekly actions without hiring a data team.
This dashboard connects your raw data across platforms and converts it into plain, actionable insights. It handles data ingestion, simple modeling, and visualization behind the scenes so non-technical users can get answers fast.
A plain-English overview: From raw data to real-time insights
Ask in natural language and receive charts, metrics, and short summaries tailored to your role. One-click edits change queries and views without coding. Automated reporting creates stakeholder-ready summaries for leaders, ops, or marketing.
How it differs from traditional tools and template-driven BI
Traditional business intelligence often needs templates or heavy setup. This platform avoids template hunting and removes analyst bottlenecks by consolidating data from multiple platforms into one logical view.
“Fewer clicks, faster answers—analytics that teams actually use.”
- Core capabilities: intuitive querying, automated reporting, role-aware summaries.
- Processing steps: ingestion → modeling → visualization, handled automatically.
- Example: turn a raw export into a weekly revenue snapshot in minutes.
| Need | How it solves it | Result |
|---|---|---|
| Scattered data | Consolidates platforms into one view | Faster decisions, less context switching |
| Template limits | Natural language queries replace rigid templates | Flexible, on-demand insights |
| Reporting load | Automated, role-aware summaries | Stakeholders get what they need, on time |
Want to try it with your own data? Spin it up here: https://businessgoeslocal.com/MRN-AI-Smart-Business-Dashboard
Core Features That Matter: Turning multiple sources of data into decisions
The right set of features turns scattered feeds into clear actions your team can use today.
Natural language processing means you can type questions like a human—no SQL or formulas—and get the correct chart or metric in seconds. Follow-ups are easy: ask for a different period or segment and the view updates instantly.
Predictive analytics
Predictive analytics analyzes historical patterns to flag churn risk, demand shifts, or revenue trends before they hit. That lets teams plan promotions or adjust staffing with time to act.
Real-time data and smart alerts
Real-time data feeds keep reports fresh. Smart alerts ping you when a KPI spikes or slips so owners can fix problems or seize opportunities immediately.
Consolidated views that end tab chaos
A single consolidated dashboard view pulls data from multiple sources to create one place for teams and tools like CRMs and ecommerce platforms. One-click prompt edits update calculations and visuals without manual rework.
“Insights should show what happened and what to do next.”
- Language processing gives clear Q&A without tech skills.
- Features surface context so action is obvious, not hidden.
- Example: ask, “Compare MRR growth by region for the last 6 months,” then set an alert for any 10% weekly drop.
| Feature | What it does | Tangible value |
|---|---|---|
| Natural language processing | Turn questions into charts | Faster answers, no analyst needed |
| Predictive analytics | Forecast churn and demand | Proactive moves, fewer surprises |
| Real-time data & alerts | Immediate notifications | Act on spikes and drops fast |
| Consolidated views | Pulls data from multiple sources | One source of truth, less context switching |
Try these features on your own metrics: test them with MRN at https://businessgoeslocal.com/MRN-AI-Smart-Business-Dashboard and see how feature-led insights change decisions.
Business Outcomes, Not Just Charts: Benefits for teams at every stage
When data stops hiding answers, teams spend less time guessing and more time improving results.
Faster reporting and automated summaries for stakeholders
Automated summaries turn weekly decks into a five-minute scan. Each report can be tailored by audience so the CFO sees forecasts while support gets CSAT highlights.
Cleaner edits with one-click prompt changes to keep data accurate
Change a definition once and every view updates. That keeps the whole team aligned on a single truth and cuts revision cycles.
What this delivers in practice
- Less time building reports; more time improving performance.
- Consistent data that reduces confusion and speeds approvals.
- Dashboards teams actually open, which means better decisions and fewer status meetings.

“Automated reporting and simple edits turn recurring work into decision time.”
| Outcome | How it helps | Who benefits |
|---|---|---|
| Faster cycles | Automated summaries and alerts | Leaders and operators |
| Aligned definitions | One-click prompt edits update all views | Whole team |
| Clear decisions | Role-tailored analytics and concise reports | Finance, ops, and support |
Try it and see the benefits: if you want faster read-to-action results without a heavy build-out, try this link and preview your next reporting cycle: https://businessgoeslocal.com/MRN-AI-Smart-Business-Dashboard
Use Cases Entrepreneurs Love: From sales and marketing to operations
Concrete examples help owners see where data tools save hours and reveal growth chances.
Sales and marketing
Monitor campaign performance daily and watch CAC/LTV trends by segment. Ask a quick question and get which segment drove the most revenue last month.
That example makes spend and creative decisions faster and clearer.
Operations and finance
Track inventory movement and model cash flow scenarios in one view. Predict demand patterns and set alerts for anomalies so your team fixes issues before customers notice.
Customer experience
Follow CSAT and NPS together, get early churn risk flags, and improve support response efficiency. Set a task to review daily alerts if refund rates cross a threshold.
| Use case | What you see | Immediate value |
|---|---|---|
| Campaigns | Revenue by segment & platform | Faster spend decisions |
| Operations | Inventory flow & anomaly alerts | Less stockouts, fewer lost sales |
| Finance | Cash flow vs. forecast | Spot variances this week |
| Support | CSAT, churn risk, response times | Better retention and efficiency |
Teams stay aligned because the same insights are visible to marketing, sales, ops, and support in a single view. Tools like this cut manual exports and free small businesses to act with speed usually seen in larger firms.
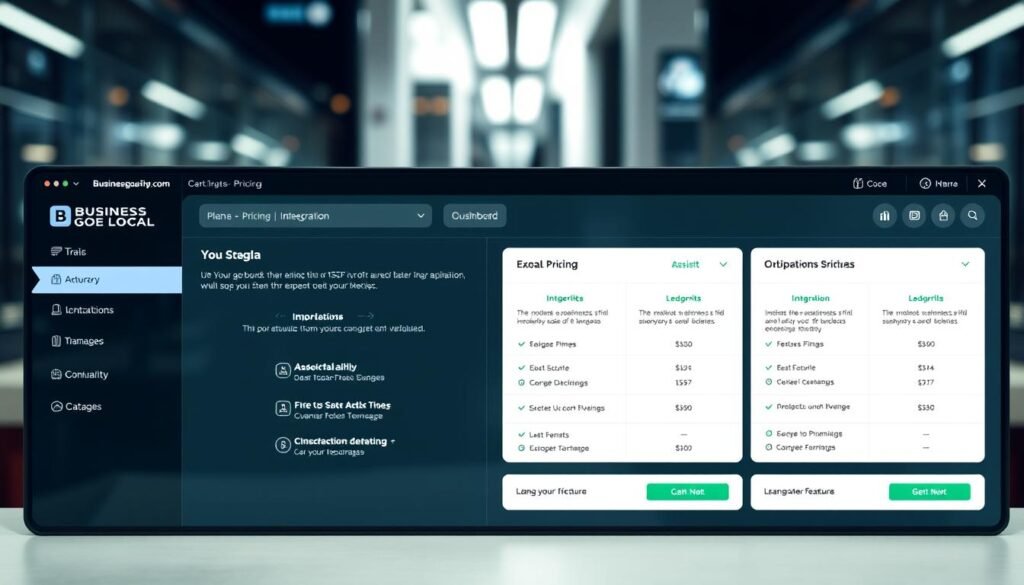
Choosing a Plan and Proving ROI: Pricing logic, integrations, and time-to-value
Start with a plan that matches your use cases so you get measurable returns in weeks, not quarters.
Match plans to goals: pick a solo plan if you work alone, a growing-team plan for shared views and permissions, or a multi-user level when you need role-based access and governance.
Match plans to stage
Begin with the smallest plan that covers your key users and core platforms. Upgrade as more users and use cases follow. This keeps pricing efficient and avoids paying for unused seats.
Integration checklist
Connect your CRM, ecommerce platform, and analytics provider first. These integrations deliver the fastest time-to-value by consolidating critical data sources.

Simple ROI model
Build a basic ROI view: hours saved on reporting + faster decisions + fewer errors. Multiply monthly saved hours by an hourly rate, add estimated gains from one better decision per month, and subtract subscription pricing.
“Pricing makes sense when one better decision a month often covers the subscription.”
- Track reporting hours before and after implementation.
- Measure decision cycle time and outcome quality across core KPIs.
- Scale plans as users and use cases grow to compound growth.
Ready to validate ROI? Start a trial and test integrations with your top platforms: https://businessgoeslocal.com/MRN-AI-Smart-Business-Dashboard
Getting Started in Minutes: Setup, onboarding, and team adoption
Fast setup turns confusion into clear action—often in a few hours, not weeks.
Start with the essentials: connect the sources you already use, pick a short set of KPIs that match your stage, and give each metric an owner. These steps cut cross-platform work and make data accessible to the whole team right away.
Connect multiple sources, define KPIs, and go live with role-based views
Follow this crisp path to first value:
- Step 1: Connect multiple sources so your data dashboard becomes data accessible for everyone who needs it.
- Step 2: Define a short KPI list—revenue, CAC/LTV, churn, cash runway—and assign owners by role.
- Step 3: Configure role-based views so users see what matters on day one and adoption rises quickly.
- Step 4: Set alerts for critical thresholds so teams act in real time without extra tasks.
- Step 5: Validate numbers against trusted reports, then iterate—fast prompt edits keep changes low-risk.
- Step 6: Share a short walkthrough to highlight capabilities and spark early wins.
- Step 7: Hold a 15-minute weekly review to align priorities and actions.
“If setup takes more than a few hours to show value, you’re overcomplicating the process.”
Quick note: consolidation removes friction between tools and gives users immediate context. The platform should make edits and summaries simple so your team spends time on decisions, not assembly.
Try the getting-started flow now and see first insights this week: https://businessgoeslocal.com/MRN-AI-Smart-Business-Dashboard
Conclusion
A single pane of clear metrics lets teams stop hunting for answers and start making fast, confident choices.
Modern dashboards turn raw data into usable insights, surface trends, and cut the time spent switching tabs. The right tools bring multiple sources together so users see patterns and act quickly.
Expect a dashboard that blends natural language queries, predictive analytics, language processing, and real-time data alerts. These features make analytics practical, not academic, and help your team focus on growth instead of data processing.
Ready to move from exploration to execution? Connect a few platforms, define KPIs, and let the tool do the heavy work. Get started with MRN today: https://businessgoeslocal.com/MRN-AI-Smart-Business-Dashboard
FAQ
What is the MRN AI Smart Dashboard: Empower Your Entrepreneurial Success?
The MRN AI Smart Dashboard is a data platform that combines natural language processing, predictive analytics, and real-time data to turn raw inputs from multiple sources into clear, actionable insights. It centralizes metrics from CRMs, ecommerce platforms, analytics tools, and finance systems so teams can track performance, spot patterns, and make faster decisions.
Stop Guessing, Start Growing: Does an AI dashboard actually solve my problem today?
Yes. By consolidating data and offering automated trend detection, forecasting, and smart alerts, the dashboard reduces manual reporting and highlights high-impact opportunities. It helps founders and managers prioritize tasks, improve campaign ROI, and react to issues like churn or inventory shortages in real time.
How does this buyer’s guide address my immediate search intent?
The guide focuses on practical features, integrations, and ROI so you can match plans to goals quickly. It explains setup steps, the kinds of insights you’ll get (like CAC/LTV and cash flow projections), and how to evaluate time-to-value for solo founders up to growing teams.
Why do small businesses win with data-driven, AI-powered decisions?
Small teams gain scale and clarity without hiring large analytics groups. Automated summaries, one-click edits to prompts, and role-based views let teams act on trends faster, reduce human error, and focus on growth activities that compound over time.
A plain-English overview: From raw data to real-time insights — how does it work?
The platform ingests raw data from multiple sources, normalizes fields, and applies models for anomaly detection and forecasting. Natural language queries let users ask plain questions and get charts or narrative summaries instantly, without SQL or BI expertise.
How does MRN differ from traditional dashboards and template-driven BI?
Unlike static templates, it offers adaptive insights, predictive models, and conversational queries. Integrations are continuous, so reports update in real time and the system surfaces patterns rather than forcing manual dashboard configuration.
What core features should I expect for turning multiple sources of data into decisions?
Look for natural language processing to query data, predictive analytics for forecasting churn and demand, consolidated views for teams, and smart alerts that notify you when metrics move beyond thresholds.
Can I ask questions in plain language or do I need SQL?
You can ask questions in plain language. Natural language processing converts your query into the right metrics, producing visualizations or written summaries so nontechnical users can get answers fast.
How accurate are the predictive analytics like churn or revenue forecasts?
Accuracy depends on data quality and volume. With clean historical data and regular integrations from CRMs and sales platforms, models deliver useful forecasts and confidence bands to guide decisions. The platform also flags when input data is insufficient.
What kind of real-time data and smart alerts can I set up?
Set alerts for spikes or drops in revenue, campaign performance, inventory levels, support SLAs, or churn risk. Alerts can route to teams, Slack, or email so stakeholders act immediately.
How are consolidated dashboard views useful for teams and users?
Consolidated views show cross-functional KPIs—sales, marketing, ops, and finance—on a single screen. Role-based permissions ensure each user sees relevant outcomes and can drill into source data when needed.
What business outcomes can I expect beyond charts?
Expect faster reporting, automated executive summaries, fewer manual processes, better forecasting, and clearer prioritization of growth opportunities that improve customer acquisition cost and lifetime value metrics.
What are common use cases entrepreneurs love?
Common use cases include campaign performance tracking and segment analysis for marketing, inventory and cash flow projections for operations and finance, and CSAT tracking with churn risk flags for customer experience teams.
How do I choose a plan that matches my goals?
Match plans by team size, number of data sources, and required features—solo founders, growing teams, and enterprise users need different access levels. Evaluate pricing against expected hours saved and decision speed gains to calculate ROI.
What integrations should be on my checklist?
Essential integrations include CRMs (like Salesforce or HubSpot), ecommerce platforms (Shopify), analytics tools (Google Analytics), payment processors, and data warehouses. Confirm connectors for those systems and support for custom sources.
How quickly can I get time-to-value and prove ROI?
Most teams see measurable value within days to weeks for reporting and alerts, and within months for predictive models to refine forecasts. Track hours saved, faster decision cycles, and improved KPIs to quantify ROI.
How fast is setup and onboarding to get started in minutes?
Basic setup—connecting core data sources and defining KPIs—can take minutes to hours. Full onboarding with role-based views and custom alerts may take a few days depending on data complexity and integrations.
What support and training help with team adoption?
Look for guided onboarding, templates for common use cases, API documentation, playbooks for KPI definitions, and customer success support to drive adoption and ensure consistent data practices.
How does the platform handle data privacy and security?
The platform should use encryption in transit and at rest, role-based access controls, and compliance with standards like SOC 2. Verify vendor policies for data retention, anonymization, and third-party sharing.
Can I customize dashboards and automate summaries for stakeholders?
Yes. Customize layouts, set automated reporting cadences, and generate narrative summaries for stakeholders so daily, weekly, or monthly briefs are ready without manual work.
Are there limits on data volume or users for each plan?
Plans often limit data rows, connectors, or user seats. Choose a plan that fits your current needs with room to scale, and check overage fees and options for enterprise licensing.
What should I watch out for when evaluating vendors?
Evaluate data connector depth, model transparency, alert reliability, customer support, and how easily the tool integrates with your existing stack. Avoid solutions that require extensive engineering to get basic insights.
How do I measure success after implementing the dashboard?
Measure hours saved on reporting, reduction in manual errors, speed of decision-making, improvements in key metrics (CAC, LTV, churn), and the number of teams actively using the platform to guide work.


