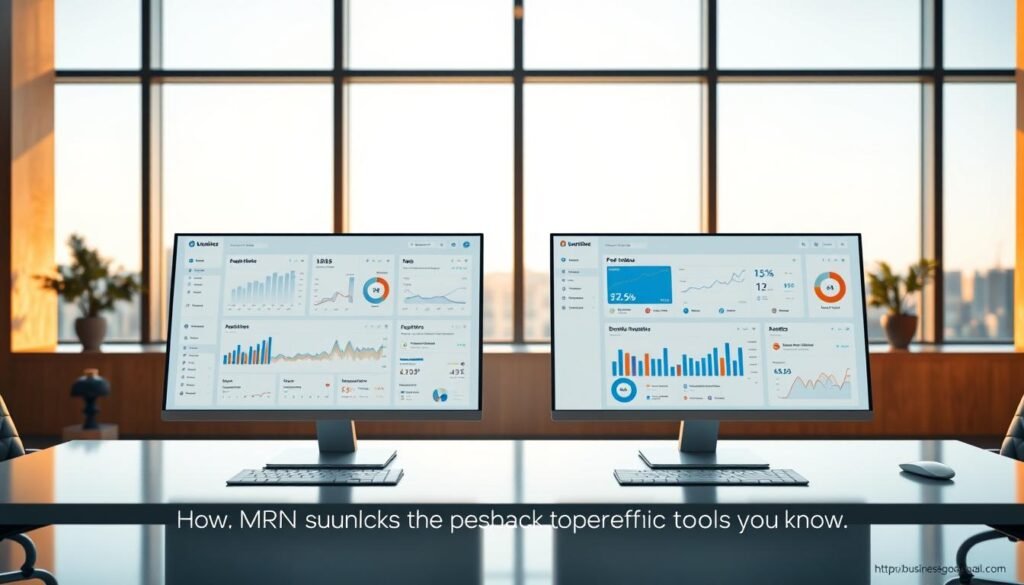
Unlock Business Insights with the MRN AI Smart Dashboard
What if one screen could replace five logins, end-of-month guesswork, and hours lost hunting for numbers?
Small business owners need clear, timely answers. This dashboard centralizes core data so you spot trends fast and act with confidence.
The interface shows unified views of sales, operations, and marketing. Live visuals highlight anomalies and explain what changed. That means fewer meetings and faster decisions.
This product is built for lean teams. Connect your core tools once, choose the KPIs that matter, and let the dashboard surface insights in plain language. You’ll spend less time on reports and more time on growth.
Key Takeaways
- Single view: See important data without juggling spreadsheets.
- Live insights: Get explanations for trends in real time.
- Easy setup: Connect tools once and use the interface right away.
- Team-friendly: More users can self-serve answers, cutting prep time.
- Better decisions: Visuals and alerts help you act faster and smarter.
Stop guessing, start growing: meet the AI dashboard that shows what’s happening now and why it matters
Stop digging through apps — get an instant story of current performance and the drivers behind it.
You need real-time clarity on KPIs and what’s driving them. Live data monitoring pulls information from CRMs, sales platforms, your website, and social media so the picture is current — not last month’s report.
Interactive visualizations make trends and anomalies obvious. Custom views let your team track the exact metrics that matter. Automated alerts flag shifts the moment they occur so you can act in time.
“See the live story of your business today — and know which channels are moving revenue.”
The solution unites multiple sources, lets you filter and drill down, and creates shareable links or exports for fast updates. That keeps stakeholders aligned and reduces prep time for meetings.
- Real-time KPIs: sales, marketing, and ops performance at a glance.
- Cross-channel trends: website and social media data in one place.
- Actionable alerts: automated signals that protect revenue and focus decisions.
See how fast clarity can be—try MRN now: https://businessgoeslocal.com/MRN-AI-Smart-Business-Dashboard
What makes an AI business dashboard game-changing today
Catch rising or falling trends in seconds and get clear explanations that point to the root cause. This level of clarity saves time and protects revenue.
Real-time trends, anomalies, and KPI shifts at a glance
Real-time monitoring surfaces sudden metric shifts so you spot problems before customers feel them. Automated anomaly detection highlights unusual patterns and pairs them with charts and short explanations.
Unified data sources in one view for smarter decisions
A single platform pulls data from your sales, marketing, and ops sources. That eliminates tab-hopping and makes queries faster. Pre-built templates and clear kpis help you launch without heavy setup.
Proactive alerts and shareable visuals your team actually uses
- Alerts: configurable pings when metrics cross thresholds so you act fast.
- Natural-language questions: ask what changed and get answers with visuals.
- Shareable reports: export links and visuals that keep teams aligned.
“Detect a drop in conversion, trace it by channel, and see the exact patterns that changed this week.”
Ready to let insight do the heavy lifting? Start here: https://businessgoeslocal.com/MRN-AI-Smart-Business-Dashboard
High-impact small business use cases you can deploy this week
Quick wins you can deploy in days bring instant visibility into pipeline health and campaign ROI. Focus on a few clear views and you’ll stop guessing and start improving rates and revenue fast.
Sales performance and pipeline clarity that drives revenue
See pipeline health, forecasted revenue, and win rates at a glance. Build a sales view that shows conversion by stage, region, and channel so managers can coach reps and unblock deals quickly.
Compare this month to last with simple charts. Use alerts to flag sudden drops in lead quality or response times so someone can call priority accounts mid-week.
Marketing ROI, content, and social media insights in one place
Combine paid, organic, content, and social media metrics to find which campaigns move revenue, not just clicks. Drill into cost per acquisition by month and spot the content that delivers assisted conversions.
Flexible dashboards let your team track trends, pause low performers, and scale winners. Deliver executive-ready summaries that turn data into clear next steps.
- Deploy sales and marketing dashboards in days — focus on doing, not building.
- Keep the team aligned with standup and review views everyone understands.
- Spin up your first dashboards this week: https://businessgoeslocal.com/MRN-AI-Smart-Business-Dashboard
Industry-ready dashboards that fit how you work
Industry-specific views turn raw data into clear, role-focused insight you can act on today.
Retail: Monitor top products, inventory turns, and regional sales in real time so you can rebalance stock and maximize availability.
Spot patterns in product performance by region and time of day to fine-tune promotions and merchandising. Tie website and marketing inputs to product-level results to match demand with supply.

Services and SaaS
Track MRR, churn, and customer health signals to spot at-risk accounts before they lapse. Connect support and usage information to understand why customers leave and what actions retain them.
Manufacturing and ops
Visualize throughput, cycle times, and downtime to pinpoint bottlenecks. Use alerts to surface anomalies in defect rates or output so floor leaders act immediately.
- Role-specific views: Build exec summaries and ops detail screens so every team sees usable metrics.
- Start fast: Use industry-ready templates, then adapt features and language as your team adopts the system.
“Choose your industry path and launch a live view of your operations.”
Ready to try a live view? Choose retail, services, or manufacturing and launch a working dashboard that maps metrics to outcomes: https://businessgoeslocal.com/MRN-AI-Smart-Business-Dashboard
MRN AI Smart Business Dashboard AI business dashboard: features that move the needle
Get instant, clear answers to live questions so your team moves from data to action in minutes.
Natural-language questions, instant answers, and visualizations
Ask plain-English queries about sales, marketing, or customer metrics and get instant charts and short takeaways. The interface builds visuals that explain change, so users can present results without extra work.
Templates and KPIs that pull data from your favorite sources
Start fast with pre-built templates and clear kpis. Connect common tools and data sources once and the platform will pull data automatically. That reduces manual imports and keeps reports current.
Automated insights, anomalies, and trend detection
Automated insights surface unusual shifts and translate them into plain-English actions. Threshold alerts call attention the moment a metric moves so decisions happen while context is fresh.
Fast sharing: links, email, meetings, and cross-team reports
Share a live link, export a report, or present visuals in a meeting with one click. Teams stay aligned and can act on the same numbers in the same minute.
“See features in action and build your first live board.”
Ready to try it? See the features in action and build your first live board: https://businessgoeslocal.com/MRN-AI-Smart-Business-Dashboard
How MRN stacks up against typical tools you know
For lean teams, the real test is how fast a tool turns raw information into action.
Ease-of-use: Many reporting platforms require long setup and specialist help. This platform gives templates, drag-and-drop builders, and natural-language queries so users get answers fast. That lowers reliance on analysts and keeps small teams moving.
Scalability: Start with one sales or ops view and add dashboards as you grow. You avoid costly migrations and keep existing reports live while expanding usage.
Cost-effectiveness: Faster time-to-value reduces hours spent building reports. That cuts costs and improves rates of adoption across users and teams.
Why teams choose simpler tools
- Out-of-the-box templates and alerts speed initial value.
- An interface built for non-technical users lowers the learning curve.
- Clear plans make it easy to match current needs and scale later.
- Support and documentation shorten setup and ongoing usage.

| Criterion | Typical BI tools | Simple platform | Practical effect |
|---|---|---|---|
| Setup time | Weeks to months | Hours to days | Faster insight and less project risk |
| Required skills | Data engineers or consultants | Non-technical users | Lower staffing needs |
| Sharing | Complex exports or permissions | One-click links and role views | Better alignment for teams |
| Cost model | High implementation fees | Clear plans and predictable rates | Easier budgeting for small shops |
“Leaders see trends side-by-side with actions, which makes prioritizing simple and reduces extra meetings.”
Example: A small sales and customer team uses a single shared dashboard for weekly reviews. They spend less time preparing and more time acting on trends.
Ready to explore plans? Check which option fits your team and get started now: https://businessgoeslocal.com/MRN-AI-Smart-Business-Dashboard
From zero to insight: your MRN setup plan for the present
Kick off setup by naming the decisions you want to make faster, then map the data that supports them.
Connect data sources, pick templates, set alerts
Step 1: Connect the most important data sources first—CRM, ads, commerce or billing. That gives instant context and lets the platform pull data quickly.
Step 2: Pick a template that fits your role, then adapt labels so the team understands charts and KPIs.
Step 3: Set alert thresholds on core kpis so you’re notified when trends shift.
Launch focused boards for sales, marketing, and leadership
Build one sales view and one marketing board. Add an executive snapshot for your weekly meeting.
Share links, run a short review, and use the live view during standups to cut prep time.
Iterate, refine KPIs, and automate reports
Collect feedback each week. Tweak visuals, remove noise, and add views that reduce recurring questions.
Automate reports by audience—send a Monday email summary and keep a live meeting view for quick decisions.
| Step | Time to launch | Immediate result |
|---|---|---|
| Connect key data sources | Hours | Unified context to pull data |
| Choose templates & set labels | Hours to a day | Faster adoption by teams |
| Set alerts & automate reports | Day | Fewer surprises, faster action |
“Keep setup light and focused—clarity wins over complexity.”
Ready to start? Build your first MRN dashboard in minutes: https://businessgoeslocal.com/MRN-AI-Smart-Business-Dashboard
Conclusion
Finish strong: turn scattered numbers into a single, trusted story your team can act on today.
This product gives a clear, real-time view of your most important data so leaders and front-line users move faster. Setup is fast, sharing is simple, and the live boards replace hours of manual reporting.
Across roles and industries, better visibility leads to better decisions and better outcomes. Choose plans that match your stage, add tools as you scale, and keep customers at the center of every metric.
Ready to stop guessing and start growing? Start your MRN journey now and see results this month: https://businessgoeslocal.com/MRN-AI-Smart-Business-Dashboard
FAQ
What data sources can the dashboard connect to?
The platform connects to common sources like Google Analytics, Shopify, Salesforce, Stripe, Mailchimp, social media accounts, and SQL databases. It pulls website, sales, marketing, and support data so teams see unified metrics without manual exports.
How quickly does the dashboard show fresh data?
Most connectors update in near real time or on a short polling interval, so you get current revenue, user activity, and campaign performance within minutes. You can also set refresh schedules to match reporting needs.
Can I ask natural-language questions and get charts back?
Yes. You can type plain-English queries like “show monthly revenue by product” or “where did churn spike last quarter” and receive instant visualizations and explanations to share in meetings.
What templates and KPIs are included out of the box?
Built-in templates cover sales pipeline, marketing ROI, customer health, product usage, and financial summaries. Each template includes recommended KPIs—MRR, conversion rates, CAC, LTV, churn rate, and retention cohorts—that you can customize.
How does the platform detect anomalies and trends?
Automated algorithms monitor time-series metrics and flag sudden changes, seasonal shifts, or gradual trends. Alerts include context and suggested actions so teams can investigate causes and respond quickly.
Can I share dashboards and reports with non-technical stakeholders?
Yes. You can share read-only links, schedule email reports, export visuals for slides, or present live in meetings. Permission controls make it easy to share specific dashboards with executives, sales, or support teams.
Is it secure to connect my revenue and customer data?
Connections use encrypted APIs and role-based access to protect sensitive information. You control user permissions, data access, and export settings to meet internal security policies and compliance needs.
What industries and use cases does it support?
The tool fits retail, services, SaaS, manufacturing, and more. Use cases include inventory and regional sales patterns for stores, churn and MRR for subscription businesses, and throughput and downtime tracking for operations.
How long does setup take for a small team?
Typical setups—connect sources, pick templates, and configure alerts—take a few hours to a couple of days depending on complexity. You can launch sales, marketing, and leadership dashboards quickly and iterate from there.
Can the dashboard reduce reporting time for my team?
Absolutely. Automated data pulls, templates, and scheduled reports cut manual reporting work. Teams spend less time preparing slides and more time acting on insights that drive growth.
What integrations are available for collaboration tools?
The dashboard supports sharing to Slack, Microsoft Teams, calendar invites, and email. You can push alerts and links into channels or set reports to post automatically before meetings.
How customizable are visuals and chart types?
Visuals are highly customizable—line, bar, funnel, cohort, heatmap, and geographical maps are available. You can adjust date ranges, segments, and thresholds to tailor views for product, marketing, or executive audiences.
Does it help improve marketing ROI and content performance?
Yes. By combining ad spend, conversion funnels, and engagement data, the dashboard highlights which channels and content drive the best returns so you can reallocate budget and optimize campaigns.
What support and onboarding resources are provided?
Onboarding includes guided setup, templates, knowledge base articles, and customer support. Many teams also get best-practice playbooks for KPIs, alert thresholds, and monthly reporting routines.
Can the dashboard handle growing data volumes and more users?
The platform scales to support increasing data and team size. It offers tiered plans and performance optimizations so analytics stay fast as your usage and data sources expand.


